

A budget vs. actual analysis compares what you planned to earn and spend with what your books show you really earned and spent, then asks why the two differ. The gap for each line is called a variance. The math takes a few minutes. The value is in the questions the gaps raise: Was the plan wrong, did the market move, or did something slip in how the business ran?
This guide shows small business owners how to build the comparison, read favorable and unfavorable variances, decide which ones deserve your time, and use the results for cash flow and tax planning.
TL;DR
- Variance is actual minus budget for each line. Higher-than-planned revenue and lower-than-planned expenses are favorable. The reverse is unfavorable.
- Investigate by size and by pattern. A large gap, or a small gap that repeats three months in a row, matters more than a one-off blip.
- Split each variance into volume, price or rate, timing, and bad assumptions before you act on it.
- Compare against both your original budget and your latest forecast, and write one or two sentences explaining each major variance.
- A budget report is a management tool. It does not calculate your tax bill, but it tells you early when profit is drifting away from the plan your tax strategy assumed.
Table of Contents
- What budget vs. actual analysis tells you
- What you need before you start
- The formula and how to read favorable and unfavorable variances
- Which variances deserve your attention
- Finding the cause: volume, price, timing, or assumptions
- Compare against the budget and the forecast
- Write the variance narrative
- Where budget vs. actual meets cash flow and taxes
- Our perspective: the budget is a conversation, not a verdict
- Getting help with the analysis
- A simple monthly routine
- Common mistakes
- FAQ
- Sources
What budget vs. actual analysis tells you
A budget is a set of expectations written before the period starts. Actuals are what happened. According to Investopedia, a budget variance is a periodic measure of the difference between budgeted and actual figures for an accounting category. Put simply, the “difference between budgeted and actual” is the variance, and the analysis is the habit of reviewing it on a schedule and explaining it.
The review answers practical questions:
- Are we making the margin we assumed when we priced our work?
- Which costs are creeping up faster than sales?
- Will we have the cash for payroll, taxes, and inventory next quarter?
- Is the budget itself unrealistic?
That last question is easy to miss. Wall Street Prep makes the point that the real payoff is not spotting deviations but asking whether they come from execution failures, changing market conditions, or unrealistic starting assumptions. A report that only lists gaps is a scoreboard. A report that explains them is a decision tool.
What you need before you start
The analysis is only as good as the two inputs.
A budget with real line items. “Expenses: $40,000” tells you nothing. Break it into the categories you can control: payroll, contractors, rent, software, insurance, marketing, cost of goods sold, and so on. Use the same categories your accounting system uses, so the comparison does not need manual re-mapping.
Clean, current books. If transactions are coded to “miscellaneous” or entered three months late, the actuals column is fiction. Reconcile your bank and card accounts before you pull the report. The IRS expects small businesses to keep organized records, such as journals, ledgers, and checkbooks, that show gross income, deductions, and credits, as described in IRS Publication 583. The same discipline makes your variance report trustworthy. If your books are behind, start with bookkeeping that helps you plan ahead.
A consistent period. Monthly is the right rhythm for most small businesses. Weekly is useful for cash-heavy operations such as restaurants and retail. Quarterly is the minimum, and it lines up with estimated tax deadlines.
The formula and how to read favorable and unfavorable variances
The basic calculation is:
Variance = Actual − Budget
Variance % = (Actual − Budget) ÷ Budget × 100
The sign alone does not say whether the news is good. It depends on the type of line:
| Line type | Actual vs. budget | Variance | Reads as |
|---|---|---|---|
| Revenue | Higher | Positive | Favorable |
| Revenue | Lower | Negative | Unfavorable |
| Expense | Lower | Negative | Favorable |
| Expense | Higher | Positive | Unfavorable |
Investopedia describes a favorable variance as revenue above the budgeted amount or expenses below what was predicted, which can lead to higher income than forecast (source). Many owners find it easiest to add a simple “F” or “U” column so nobody has to reason about signs at every meeting.
A worked example
The numbers below are illustrative, for a small service business in one quarter.
| Line | Budget | Actual | Variance | Variance % | F/U |
|---|---|---|---|---|---|
| Revenue | $120,000 | $111,000 | −$9,000 | −7.5% | U |
| Contractor costs | $30,000 | $36,000 | +$6,000 | +20.0% | U |
| Software and subscriptions | $4,500 | $4,200 | −$300 | −6.7% | F |
| Marketing | $9,000 | $6,000 | −$3,000 | −33.3% | F |
| Net operating profit | $40,500 | $26,700 | −$13,800 | −34.1% | U |
On the surface, two expense lines are favorable. But the story is different: revenue came in under plan, contractor costs rose even though sales fell, and the marketing underspend may be part of why revenue is soft. A scan of the favorable and unfavorable labels would miss that connection. This is why you read the lines together.
Which variances deserve your attention
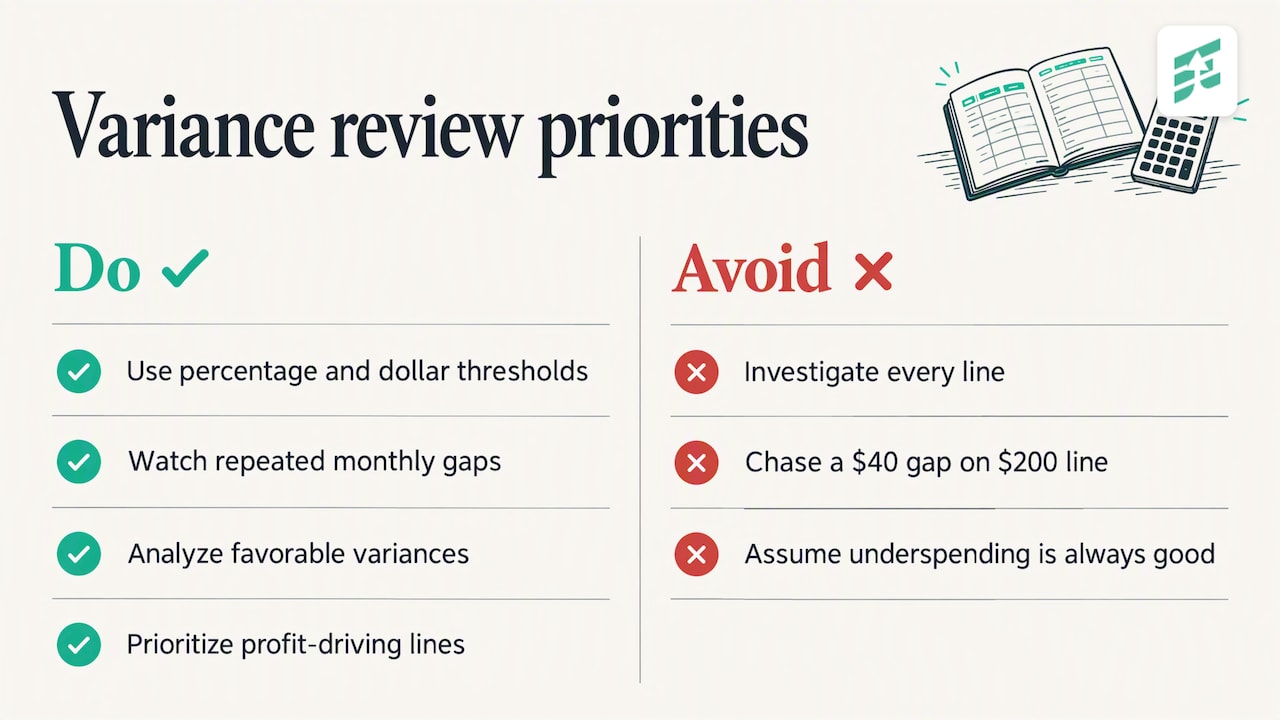
You will never investigate every line, and you should not try. Pick a threshold and a pattern rule.
Set a dual threshold. For example, look into any line that is off by more than 10% and more than $1,000. The percentage catches small categories that have run away. The dollar floor keeps you from chasing a $40 difference on a $200 line. Pick numbers that fit your scale and keep them for the year so months compare cleanly.
Watch for trends. A line that is 4% over three months in a row is a stronger signal than one that is 15% over once. Recurring gaps usually mean the budget assumption is wrong or a cost has structurally changed.
Examine favorable variances too. Underspending feels good, but it is not automatically good. OpenStax notes that favorable variances should be analyzed to judge whether costs were cut too far, or whether better materials should have been bought (OpenStax, Principles of Managerial Accounting). In the example above, the marketing savings is the kind of favorable number that can quietly cost you revenue.
Prioritize lines that drive profit. For most small businesses that means revenue, cost of goods sold or direct labor, and payroll. Those three usually explain most of the movement in net income.
Finding the cause: volume, price, timing, or assumptions
Once a variance is worth a look, sort it into one of four buckets. Each calls for a different response.
Volume
Did you sell or produce more or fewer units than planned? If revenue is down 7.5% because you completed fewer jobs, the issue is demand or capacity, not pricing. Variable costs should have fallen with volume. If they did not, that is a second finding.
Price or rate
Did you charge, or pay, a different amount per unit than planned? This is where labor is a classic culprit. OpenStax explains that labor variances can come from supply and demand, union contracts, or hiring people at different skill levels, which then flows through the cost of everything produced (OpenStax, labor variances). In the example, if contractor costs rose 20% while job counts fell, the likely cause is a higher hourly rate or more hours per job, not more work.
A quick way to separate the two: hold the price constant and compute what volume alone would have done, then attribute the remainder to price. For a cost line, that looks like this:
- Volume effect = (actual units − budgeted units) × budgeted price per unit
- Price effect = (actual price − budgeted price) × actual units
The two add up to the total variance.
Timing
Sometimes money simply moved between periods. An annual insurance premium paid in March, a large client invoice paid in the next month, or a delayed equipment purchase will distort a single month and correct itself later. Timing variances are why a year-to-date view next to the monthly view is worth having. If a gap disappears when you look at the year to date, it was timing.
Assumptions
The budget may have been optimistic. Perhaps you assumed 15% growth with no added marketing spend, or you used last year’s supplier prices. If the assumption was wrong, fix the forecast rather than blaming operations. This is the Wall Street Prep point again: sort execution problems from market shifts from unrealistic starting figures before deciding who or what needs to change.
Compare against the budget and the forecast
Your original budget is a fixed yardstick: it shows how you are doing against what you committed to. But by month four it may be stale. A rolling forecast, updated with what you know now, is a better guide to the rest of the year.
Business.com notes that comparing results to both gives two kinds of value: the budget tests performance against original commitments, and the forecast tests how accurate your current expectations are. A practical layout is four columns: actual, original budget, latest forecast, and the variance to each. If you keep missing the forecast too, your forecasting process needs work, not just your execution. For more on building that forward view, see our guide to cash flow forecasting for small businesses.
Write the variance narrative
Numbers without explanation get ignored. For every variance above your threshold, write one to three sentences covering four things:
- What happened: “Contractor costs were $6,000 (20%) over budget.”
- Why: “Two projects needed senior contractors at a higher hourly rate.”
- Whether it will continue: “One project ends in November; the other continues through Q1.”
- What we are doing: “Reprice new quotes for this service and revise the Q4 forecast.”
Keep these notes in the same file as the report. After a year you will have a record of why the business behaved as it did, which is valuable when you plan next year’s budget, apply for a loan, or hand figures to your CPA.
Sometimes the variance review raises a bigger question, such as whether to pursue a new type of contract or opportunity at all. A structured bid/no-bid scorecard for small business can help you weigh that against the margins your actuals show you can really deliver.
Where budget vs. actual meets cash flow and taxes
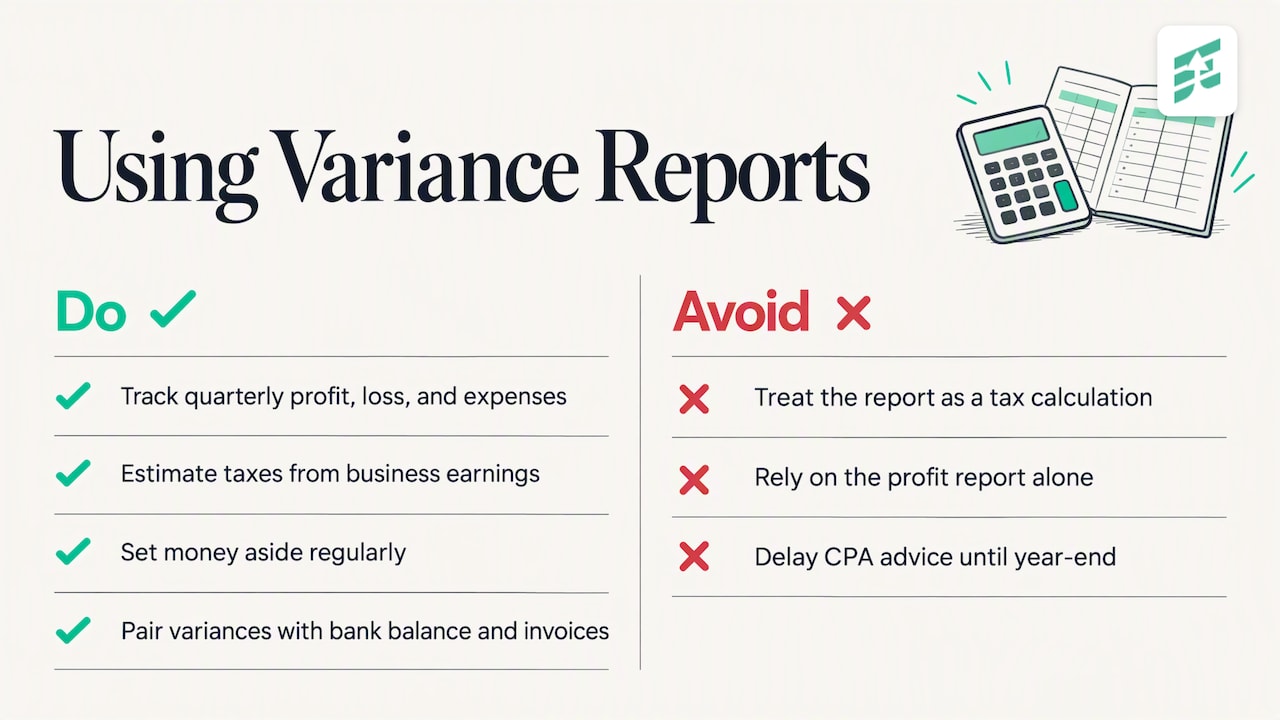
Budget vs. actual is a management report, not a tax calculation. It does not determine what you owe, because taxable income follows tax rules for depreciation, deductions, timing, and entity type that differ from your internal budget. What it does is warn you early when profit is moving away from the figure your tax plan assumed.
That matters most for estimated taxes. The SBA’s guidance on quarterly taxes advises organizing quarterly records of profits, losses, and expenses, estimating taxes from business earnings, and setting money aside regularly. A monthly variance review gives you that quarterly picture almost for free. If profit is running 30% above budget in August, you want to know before the September payment, not in April. For the mechanics, read our explainer on quarterly estimated tax payments.
It also keeps cash honest. A profitable quarter can still be a cash-tight one if receivables lag or you prepaid large costs. Pair your income-statement variances with a look at your bank balance and open invoices. The SBA’s small business management guidance stresses proper bookkeeping and calls the balance sheet the foundation of managing finances, which is a reminder that the profit report alone is not enough. Our overview of financial statements for small business owners shows how the pieces fit together.
What the report cannot tell you: whether an expense is deductible, whether your entity structure is the right one, or how a big purchase changes your year-end position. Those are questions for a CPA, ideally before the purchase or the year-end, not after. When a large unfavorable or favorable swing appears in profit, that is the moment to ask your tax professional whether anything should change in your estimates or plan. Our year-round tax planning guide lays out what to review each quarter.
Our perspective: the budget is a conversation, not a verdict
Most small business owners we meet in southern Oregon do not skip budgeting because they dislike numbers. They skip it because the first version of a budget is always wrong, and a report full of red feels like a failure. We see it differently. Every variance is information you did not have before.
Our approach is proactive and year-round. Tax, accounting, payroll, and advisory decisions are connected, so the variance report should be too. A payroll overage is a margin question and a cash question, and it will show up in your tax picture. A real estate investor watching repairs against plan and a startup watching burn against runway are asking the same thing in different words: is my plan still true?
Our advice is simple. Start with ten lines, not a hundred. Review monthly, in the same week each month. Write the narrative. Update the forecast, not just the report. And bring the findings to your CPA before decisions that move your tax result, not after.
— Justin Ash, CPA
Getting help with the analysis
If your books are current, you can run this analysis yourself with a spreadsheet or your accounting software. If they are not, or if you are not sure your categories match your budget, the first fix is the bookkeeping, not the report. At Elevate Business Consulting in Medford, we pair accounting and bookkeeping, tax planning, and payroll with ongoing advisory, so the variance review feeds directly into forecasting and tax decisions. If you already use QuickBooks and want the reports set up properly, our QuickBooks consulting services cover that. If you are weighing who you need, our comparison of a bookkeeper vs. an accountant is a good start.
A simple monthly routine
- Close the month. Reconcile bank and card accounts and code all transactions.
- Pull the report. Actual, budget, forecast, variance in dollars and percent, with F or U marked.
- Flag the lines. Apply your threshold and your three-month trend rule.
- Sort each cause. Volume, price or rate, timing, or assumption.
- Write the narrative. Cause, duration, response.
- Update the forecast. Change next month’s expectations if a variance will persist.
- Check cash and taxes. Compare profit to your estimated tax plan and your cash balance.
Thirty to sixty minutes a month is realistic once the structure exists. If it takes longer, the cause is usually messy books or too many budget lines.
Common mistakes
- Treating every variance as a problem. Some are timing, and some are good news.
- Budgeting once and never revising. Keep the original for accountability but forecast from reality.
- Comparing mismatched categories. If the budget groups “software” and the books split it five ways, map them first.
- Ignoring favorable variances. Underspending on marketing, maintenance, or training often shows up as lost revenue later.
- Skipping the explanation. A report with no narrative cannot support decisions.
FAQ
What is the difference between budgeted and actual?
Budgeted figures are your plan for a period, set in advance. Actual figures are what your accounting records show after the period closes. The difference is the variance, usually expressed in dollars and as a percentage of the budget.
How do you compare actual results to budgeted results?
Line up each category side by side, subtract the budget from the actual, and divide by the budget for a percentage. Then label each line favorable or unfavorable based on whether it is revenue or an expense. Review the largest and most persistent gaps first.
How often should a small business review budget vs. actual?
Monthly works for most. Cash-intensive businesses may want a weekly view of revenue and key costs. At minimum, review quarterly so the results can inform your estimated tax payments.
Is a favorable variance always good?
No. A cost that came in under budget may reflect delayed work, skipped maintenance, or cut marketing that hurts future revenue. Look at why the line was lower before celebrating it.
Sources
- Budget Variance: Definition, Primary Causes, and Types (Investopedia)
- Budget to Actual Variance, Formula and Calculation Example (Wall Street Prep)
- 7.5 Explain How Budgets Are Used to Evaluate Goals (OpenStax)
- 8.3 Compute and Evaluate Labor Variances (OpenStax)
- Budgeting and Forecasting Across Multiple Departments (Business.com)
- Quarterly Taxes: The Basics (U.S. Small Business Administration)
- Publication 583, Starting a Business and Keeping Records (IRS)
- Manage your business (U.S. Small Business Administration)